Ecommerce Report: June 2026
Well. What a weird month in ecommerce.
Let's talk about what's happening, why you might be feeling it, and what to do about it.
Below, I've compiled data across 50 stores within Ecommerce Hawaii's portfolio and shared the findings to help ecommerce owners understand what's actually going on right now.
THE ECONOMY
Let’s start big and zoom into the nitty gritty action items last. On a macro-level:
Consumer sentiment just hit an all-time low — the lowest recorded since tracking began in the 1970s. At the same time, 401(k) hardship withdrawals are at an all-time high, as people are pulling from their life savings to deal with the problems of today. This is as bleak of a signal as you can find. All this being said, discretionary spending is clearly and obviously compressing across the board.

Layoffs aren't slowing down either. Nearly 900 people lose their tech job every single day — a 13% higher rate than last year. Some notable companies that cut 10–20% of their workforce in recent months:
Meta
Oracle
Robinhood
Atlassian
Wix
Webflow
Intuit
ClickUp
PayPal
Snap
All of this to say…anxiety about the economy isn’t a baseless suspicion or feeling. It's a tough time for the average worker, and the data proves it.
HOW IT'S AFFECTING STORES
Here are a few telling data points from brands in our portfolio that capture the current economy:
A store doing $750K/year averaged 10 orders/day for the past 12 months. The brand recorded only 2 zero-sale days in total during this time. In the last 30 days alone: 6 zero-sale days.
A $2M/year store had only 2 days under 5 orders in the past year. This June: 3 such days — despite increasing ad spend in an attempt to combat it.
According to Northbeam analytics, Meta Ads conversion rates (CVR) dropped double digits on average in the week of 6/7 - 6/14. We almost never see double-digit drops on a channel as distributed and wide as Meta — but it happened.
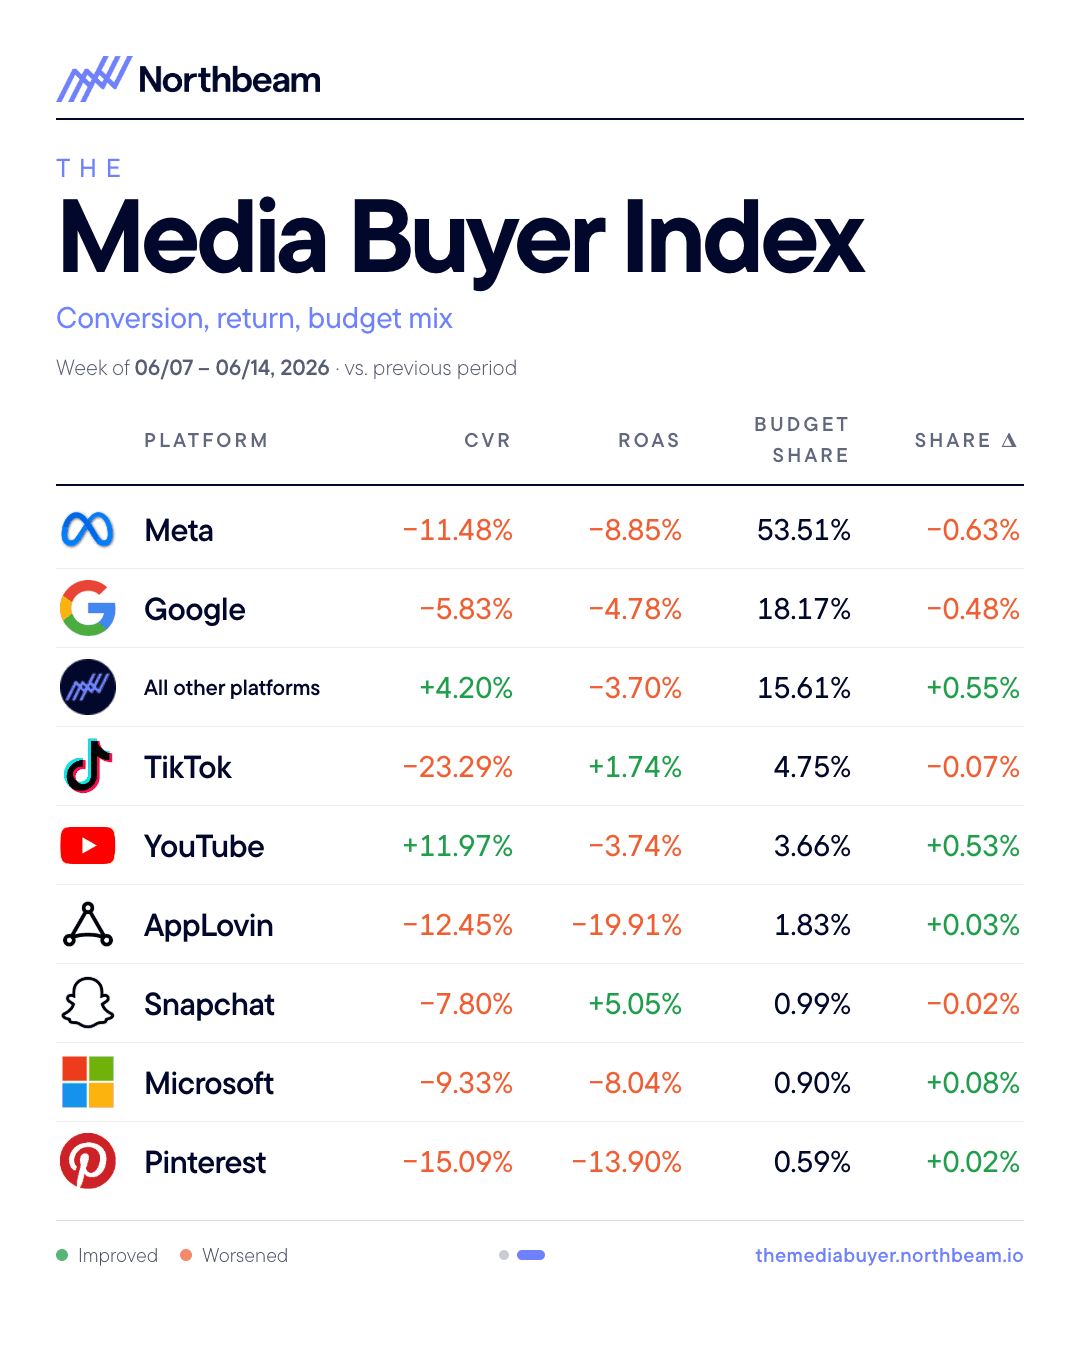
Internally, our 50 measured businesses showed a similar Meta CVR decline of 12.28% MTD.
Part of that may trace back to May, when Meta laid off 10% of its workforce — roughly 8,000 people. Cuts of that scale don't happen in a vacuum. They ripple through product quality, ad delivery, and optimization systems.
To make matters worse, add on the platform instability during the month:
a Shopify partial outage on June 24
a Meta disruption on June 12
a major Meta/Instagram/Messenger global outage on June 23.
If you haven’t yet, I encourage you to look at your MTD charts and highlight those dates. The effect on revenue was substantial.
All considered, Meta was a mess. It crashed multiple times, and even when it was functioning, it was a fraction of its former-self.
WHAT THIS MEANS FOR YOUR STRATEGY
Macro factors don't change the fundamentals of building your business — but they do show up in your P&L. Growth rate expectations might need to be updated.
Brands without a growth strategy right now face a binary choice:
Go lean — cut variable and fixed costs, capture profit.
Scale smart — cut fixed costs, increase variable spend to capture volume.
Expecting last year's performance on autopilot isn't a strategy. It's wishful thinking.
WHAT'S ACTUALLY WORKING
1. Channel diversification & Wholesale
Brands with spend distributed across Meta, TikTok, Shop, and Google (especially YouTube) — alongside multiple wholesale and retail partners — weathered the disruptions *much better than single-channel stores. In the simplest sense: if you live by Meta, you die by Meta.
2. Double down on what's still selling
In an almost-contradictory message, concentration on a product-level showed positive benefits alongside channel-diversification. Some products hold up better in a downturn. Our recommendation is to put your effort into identifying your store’s most resilient products — then, stack creative behind it. More UGC, more angles, more volume, and — my personal favorite — well, we’ll keep that technique in house.
All in all, don't spread evenly when the ground is uneven. You’re likely wasting significant spend investing into unprofitable products or “Creative Testing” at an inappropriate percentage…more on this another time.
Here are a few examples of our stores utilizing a concentrated structure and its positive effects amidst the June cooldown:
Store A (Wellness) recorded 109% June Growth YoY with an ad account that focuses on one product.
Store B (Sports) recorded 81% June Growth YoY after narrowing the ad account (85% spend concentration) to one product.
Store C (Swimwear) recorded 157% June Growth YoY with an ad account that focuses on only 2 products.
3. Check your calendar before you panic
Did you slow down last June too? Did you send the same internal fire-drill emails? If so, you're feeling two things at once: seasonal cyclicality and macro compression. Separate them.
Seasonal slowdowns have seasonal solutions — offseason promotions, new product releases, reasons to shop. Cool heads prevail. Your buyers might just be on vacation.
*
CONCLUSION:
Things are hard right now. But hard is navigable with the right framework.
It's through these strategies — and several more we didn't cover here — that Ecommerce Hawaii's partner brands recorded a +6.23% increase in ROAS in June: a net +15% better than the platform average reported by Northbeam analytics above (albeit a narrower time frame).
But numbers only tell half the story. How you interpret the data matters as much as the data itself. A below-average month can look like the beginning of the end — or it can be read for what it more likely is: a forecastable return to the mean. Things cooling down before they heat back up.
Benjamin Hasegawa, Ecommerce Hawaii